Netdata is a free open source, scalable, adaptive, customizable, extensible, and powerful real-time performance and health monitoring tool for Linux systems, which collects and visualizes metrics. It works on desktops, personal computers, servers, embedded devices, IoT, and more.
Read Also: How to Monitor Apache Performance Using Netdata on CentOS 7
It is a system health monitoring tool which allows you to keep an eye on how your systems and applications or services such as web servers are operating, or why they are slow or misbehaving. It is extremely effective and efficient in terms of CPU usage as well as other system resources.
In this article, we will explain how to monitor Nginx HTTP web server performance using Netdata on CentOS 7 or RHEL 7 distribution.
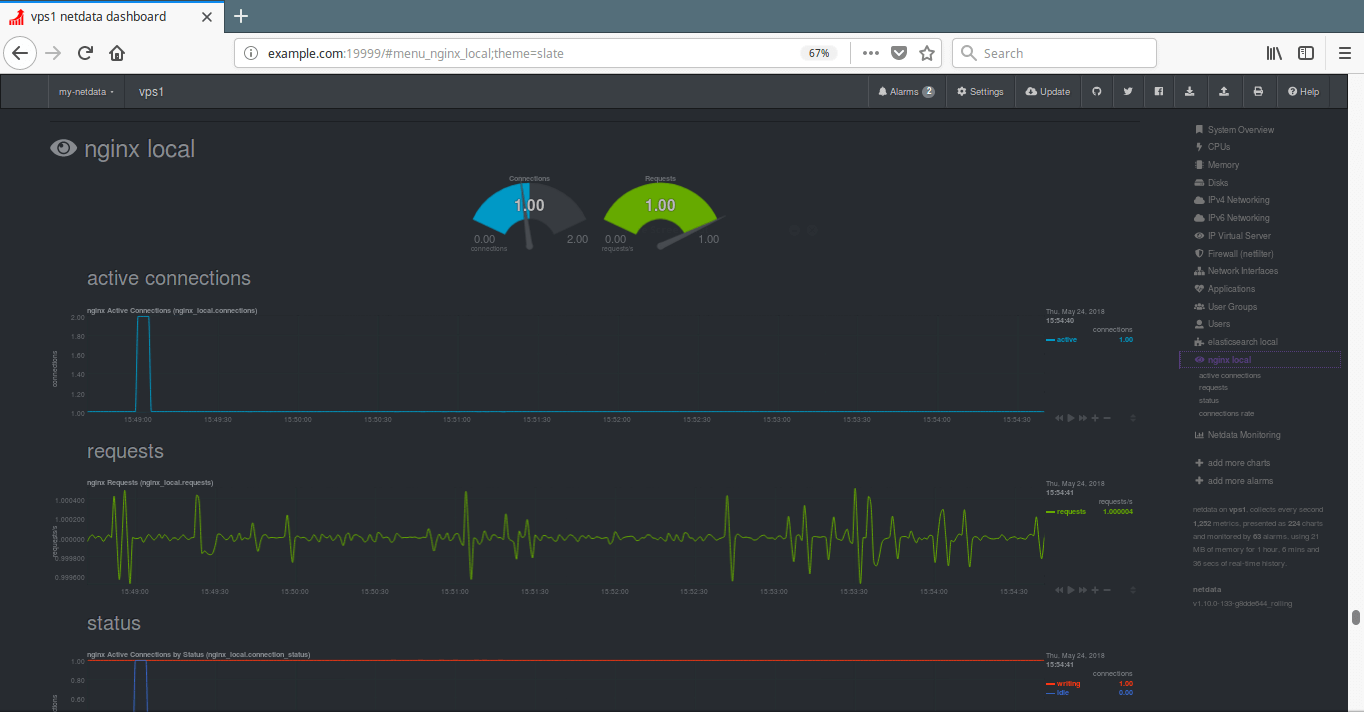
By the end of this guide, you will be able to watch visualizations of active connections, requests, status, and connection rate of your Nginx web server.
Requirements:
- A CentOS 7 Server or RHEL 7 Server with Minimal Install.
- Nginx HTTP server installation with ngx_http_stub_status_module enabled.
Step 1: Install Nginx on CentOS 7
1. First start by enabling EPEL Repository and then install Nginx HTTP server from the EPEL software repositories using the YUM package manager.
# yum install epel-release
# yum install nginx
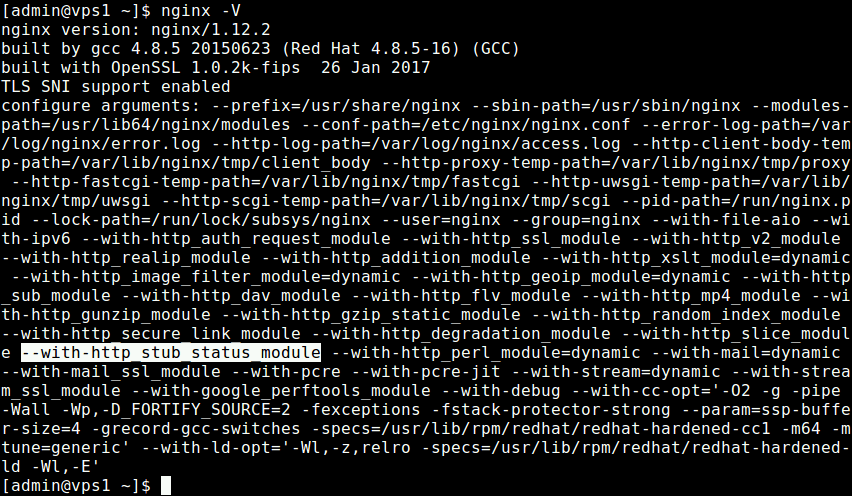
2. Next, check the version of Nginx installed on your system, it should be compiled with the stub_status module indicated by the --with-http_stub_status_module configuration argument, as shown in the following screenshot.
# nginx -V
3. After successfully installing Nginx, start it and enable it to auto-start at system boot and ensure that it is up and running.
# systemctl status nginx
# systemctl enable nginx
# systemctl status nginx
4. If you are running firewalld dynamic firewall, you need to open port 80 (HTTP) and 443 (HTTPS) which the web server listens on, for client connection requests.
# firewall-cmd --permanent --add-port=80/tcp
# firewall-cmd --permanent --add-port=443/tcp
# firewall-cmd --reload
Step 2: Step 2: Enable Nginx Stub_Status Module
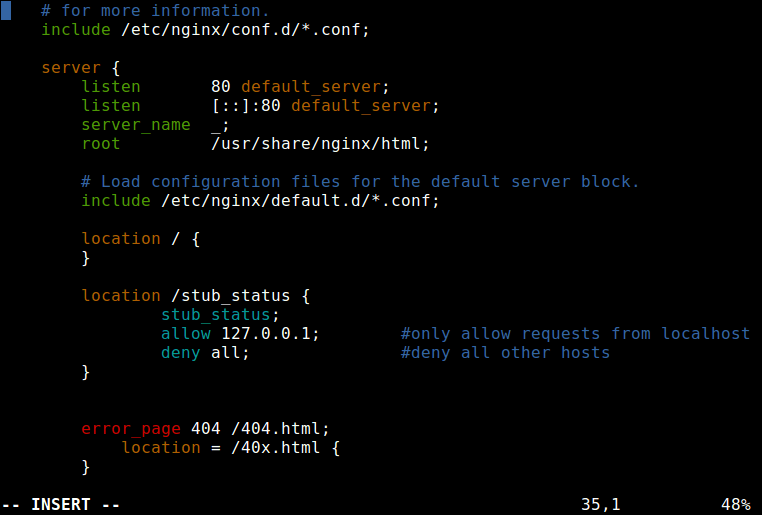
5. Now enable stub_status module which netdata uses to collect metrics from your Nginx web server.
# vim /etc/nginx/nginx.conf
Copy and paste the location configuration below into the server block, as shown in the screenshot.
location /stub_status {
 	stub_status;
 	allow 127.0.0.1;	#only allow requests from localhost
 	deny all;		#deny all other hosts
 }
6. Next, test the new nginx configuration for any errors and restart the nginx service to effect the recent changes.
# nginx -t
# systemctl restart nginx
7. Next, test the nginx status page using the curl command-line tool.
# curl http://127.0.0.1/stub_status

Step 3: Install Netdata on CentOS 7
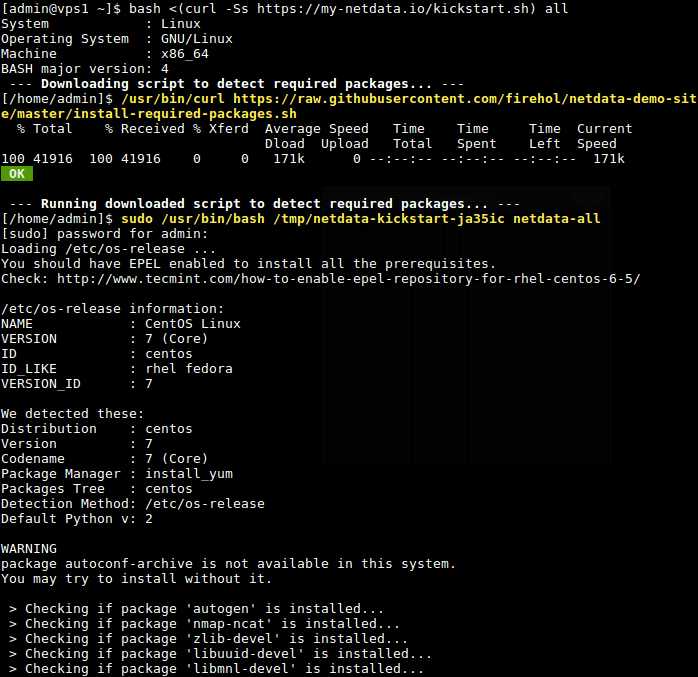
8. There is a one-liner shell script you can use to kick start installation of netdata latest release from its github repository. This script will download another script to detect your Linux distro and installs the required system packages for building netdata; thereafter grabs the latest netdata source files; builds and installs it.
Use the command below to launch the kickstarter script, the option all allows for installing required packages for all netdata plugins including the ones for Nginx.
# bash <(curl -Ss https://my-netdata.io/kickstart.sh) all
If your not accessing the system as root, you will be prompted to enter your user password for sudo command, and you will also be asked to confirm certain operations by pressing [Enter].
8. After building, and installing netdata, the script will automatically start the netdata service via systemd service manager, and enables it to start at system boot. Netdata listens on port 19999 by default.
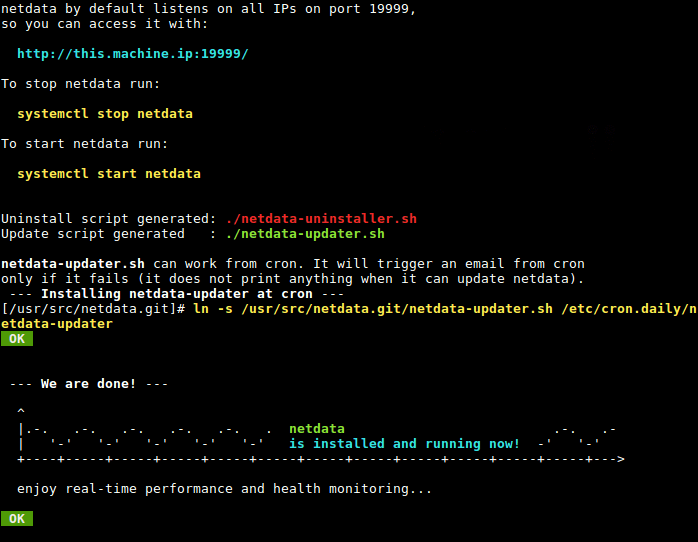
9. Next, open port 19999 in the firewall to access the netdata web UI.
# firewall-cmd --permanent --add-port=19999/tcp
# firewall-cmd --reload
Step 4: Configure Netdata to Monitor Nginx Performance
9. The netdata configuration for Nginx plugin is stored in the /etc/netdata/python.d/nginx.conf configuration file, written in YaML format.
# vim /etc/netdata/python.d/nginx.conf
The default configuration is enough to get you started with monitoring your Nginx web server.
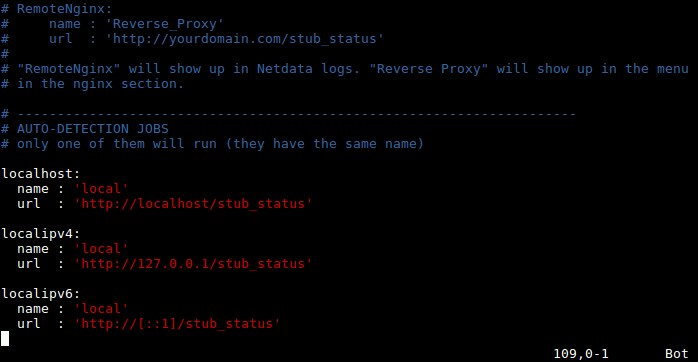
In case you have made any changes to configuration file, after reading the documentation, restart the netdata service to effect the changes.
# systemctl restart netdata
Step 5: Monitor Nginx Performance Using Netdata
10. Now open a web browser and use the following URL to access the netdata web UI.
http://domain_name:19999
OR
http://SERVER_IP:19999
From the plugin list on the right hand side, click on “nginx local” to start monitoring your Nginx web server. You will be able to watch visualizations of active connections, requests, status, and connection rate as shown in the following screenshot.
Netdata Github repository: https://github.com/firehol/netdata
That’s all! Netdata is a real-time, distributed performance and health monitoring tool for Linux systems. In this article, we showed how to monitor Nginx web server performance using netdata on CentOS 7. Use the comment form below to share any queries or thoughts about this guide.




You can also install netdata on CentOS 7 using RPM repo: https://harbottle.gitlab.io/harbottle-main/7/x86_64/
@harbottle
Okay, thanks for sharing.
Good helping hands towards needy, keep share the technical articles.
Thanking you.
@Ashish
Thanks for the kind words of appreciation and encouragement. We are glad that you find our work helpful.